Sports Analysis Software for Coaches
Make data-driven coaching decisions. Track e1RM progression, weekly volume, PR timelines, RPE accuracy, and mesocycle comparisons across all your athletes.
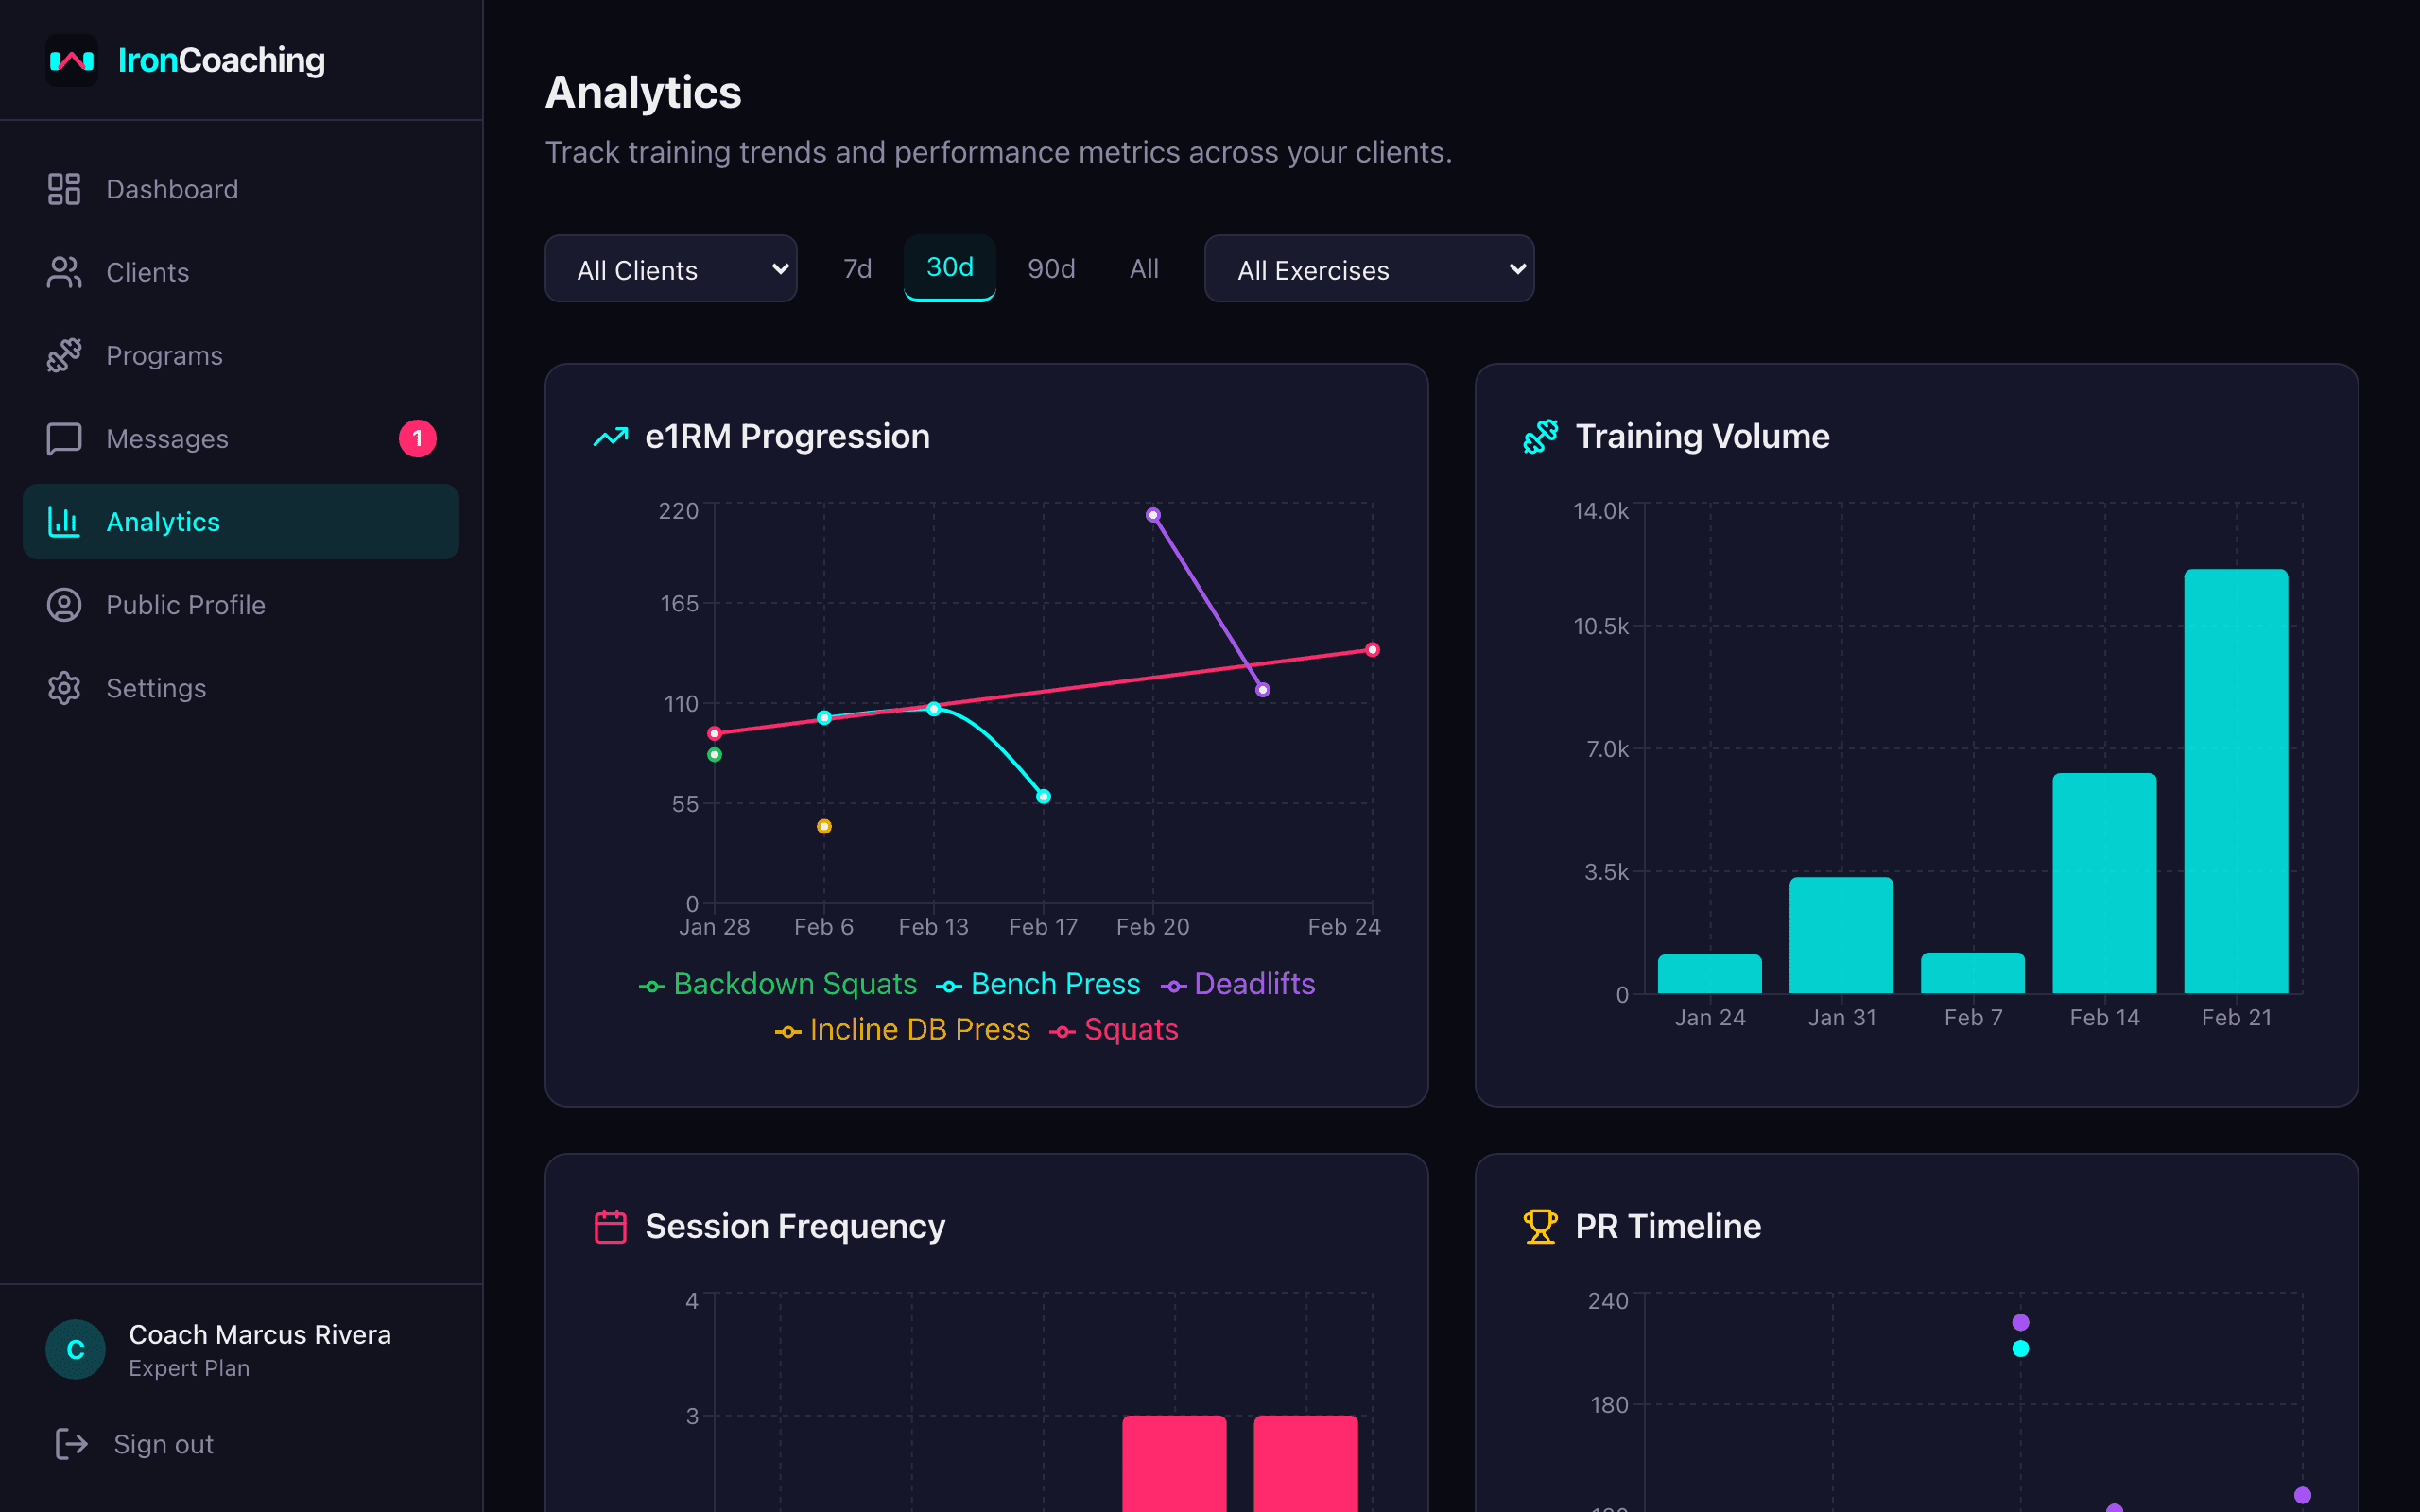
IronCoaching's analytics dashboard transforms raw training data into actionable insights. Track estimated 1RM progression, weekly volume trends, training frequency, PR timelines, RPE accuracy, and block-to-block comparisons — all in real time from your athletes' IronLedger sessions.
Last updated 2026-04-05
Performance analytics — e1RM progression, volume tracking, and training frequency.
Key Features
e1RM Progression Charts
Track estimated one-rep max trends for every exercise. Spot plateaus and adjust programming before they stall.
Volume Tracking
Monitor weekly training volume per muscle group or movement pattern. Compare across mesocycles.
Training Frequency
See how often athletes are training each muscle group. Ensure program adherence and recovery balance.
PR Timeline
Track personal records over time. Celebrate milestones and identify peak performance periods.
Exercise Comparison (Expert)
Compare up to 3 exercises side-by-side with e1RM, volume, or max weight overlays. Pearson correlation cards reveal which lifts progress together.
Frequency & Volume by Muscle Group (Expert)
See weekly volume per muscle group with color-coded zones — green for optimal (10-20 sets), yellow for low/high, red for excessive (25+).
RPE Accuracy (Expert)
Compare prescribed RPE targets with athlete-reported RPE. Identify athletes who consistently under- or over-report.
Block Comparisons (Expert)
Compare volume, intensity, and outcomes across training blocks. Optimize future mesocycles based on data.
Searchable Filters
Filter by client, date range, and exercise using searchable combobox dropdowns with autocomplete.
How It Works
- 1
Clients train with IronLedger
Athletes log sets, reps, weights, and RPE in the IronLedger app during their workouts.
- 2
Data syncs to your dashboard
Training data flows to your analytics dashboard in real time via the shared Supabase backend.
- 3
Charts and insights update
Visualizations update automatically — e1RM trends, volume charts, and compliance metrics.
- 4
Make informed decisions
Use data to adjust volume, intensity, or exercise selection for each athlete.
Related Features & Solutions
Client Management
Manage all your coaching clients from a single dashboard. Track progress, set goals with auto-progress, assign programs, monitor session compliance, and generate per-client AI insights.
Learn moreIronLedger Integration
IronCoaching connects directly with IronLedger, the workout tracker app for athletes. See real-time training data, assign programs, and track compliance without asking clients to log anything extra.
Learn moreAI Insights
Get intelligent training analysis, program recommendations, PR predictions with accuracy tracking, and weekly summaries powered by AI. Rate insights to teach the AI your coaching style through a self-improving feedback loop.
Learn moreSports Performance Coaching
Learn morePowerlifting Coaching
Learn moreOnline Strength Coaching
Learn moreFrequently Asked Questions
Pro includes e1RM progression charts, weekly volume tracking, training frequency analysis, and the PR timeline. Filter by client, date range, and exercise.
Expert adds exercise comparison charts (up to 3 exercises with Pearson correlation), frequency and volume tracking by muscle group with volume zone coloring, RPE accuracy tracking, block/mesocycle comparisons, volume distribution charts, and a client comparison table. Plus AI-powered insights for deeper analysis.
All analytics data comes directly from your athletes' IronLedger training sessions. When they log a set, it appears on your dashboard within seconds. No manual data entry required.
Yes. The analytics dashboard includes a filter bar for client selection, date range, and exercise. Compare different training periods or focus on specific lifts.
Ready to level up your coaching?
Create your free IronCoaching account and start building programs, managing clients, and growing your business today.